IPU-Chart wordpress plugin resources analysis
| Download This Plugin | |
| Download Elegant Themes | |
| Name | IPU-Chart |
| Version | 1.0.5 |
| Author | Thomas Müller Flury, ipublia |
| Rating | 60 |
| Last updated | 2015-02-26 03:26:00 |
| Downloads |
6406
|
| Download Plugins Speed Test plugin for Wordpress | |
Home page
Delta: -2%
Post page
Delta: -2%
Home page PageSpeed score has been degraded by 2%, while Post page PageSpeed score has been degraded by 2%
IPU-Chart plugin added 292 kB of resources to the Home page and 292 kB of resources to the sample Post page.
IPU-Chart plugin added 0 new host(s) to the Home page and 0 new host(s) to the sample Post page.
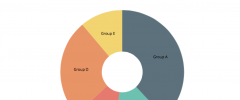
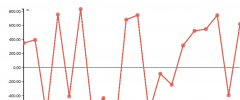
Great! IPU-Chart plugin ads no tables to your Wordpress blog database.IPU-Chart is a Wordpress shortcode to create many different chart types inside your blog or page. It works perfectly on large computer screens as well as on tablets and smaller mobile screens. The data to display can reside directly in the document or it can be fetched from a remote service.
IPU-Chart has many options to style a chart. Add your own color palette or use the functions to generate color palettes that come with the plugin.
Features
- Creates bar, line, pie, donut, scatter, bubble and world map charts
- Supports data in json, csv or tsv format (Excel, Numbers)
- Lets you enter the data directy in a blog or page
- Loads the data from a remote service (database)
- Updates the data automatically if desired
- Has many options to style a chart with css or built-in color functions
Usage
To display a bar or line chart inside a post or page add a div element with an id (that’s where the chart will be rendered) and enter the template configuration inside the [ip4] shortcode.
Data defined inside the document:
<div id="kcal" style="width:90%; font-size:0.8em"></div>
...

[ip4]{
    "template": ip4.barChart(),
    "parentElement": "#kcal",
    "data": {
        "reader": ip4.dataReader()
            .data([ {"x": "Apple", "y": 55 },
                    {"x": "Avocado", "y": 145 },
                    {"x": "Banana", "y": 95 },
                    {"x": "Grapefruit", "y": 30 },
                    {"x": "Kiwi", "y": 55 } ])
    },
    "d3": {
        "yLabel": "kilo calories (kcal)"
    }
}[/ip4]
To display a line or pie chart just enter ip4.lineChart() or ip4.pieChart() as template.
Data refresh the data from an url every 20 seconds:
<div id="kcal" style="width:90%; font-size:0.8em"></div>
...

[ip4]{
    "template": ip4.barChart(),
    "parentElement": "#kcal",
    "data": {
        "reader": ip4.dataReader()
                      .uri("http://example.org/kcal")
                      .interval(20000)
    },
    "d3": {
        "yLabel": "kilo calories (kcal)"
    }
}[/ip4]
Note for existing users: The attribute-based, old interface is still included in the plugin.
Further Information
- The ip4 User Guide for detailed descriptions and examples.
- The IPU-Chart User Guide for the legacy interface.
- The Support Forum.


