WP XHProf Profiler wordpress plugin resources analysis
| Download This Plugin | |
| Download Elegant Themes | |
| Name | WP XHProf Profiler |
| Version | 0.9 |
| Author | Alberto Varela |
| Rating | 100 |
| Last updated | 2012-01-08 11:56:00 |
| Downloads |
1381
|
| Download Plugins Speed Test plugin for Wordpress | |
Home page
Delta: 0%
Post page
Delta: 0%
Home page PageSpeed score has been degraded by 0%, while Post page PageSpeed score has been degraded by 0%
WP XHProf Profiler plugin added 23 bytes of resources to the Home page and 27 bytes of resources to the sample Post page.
WP XHProf Profiler plugin added 0 new host(s) to the Home page and 0 new host(s) to the sample Post page.
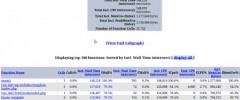
Great! WP XHProf Profiler plugin ads no tables to your Wordpress blog database.WP XHProf Profiler plugin is an easy way to profile your plugins and themes when you are coding or debugging. To get it done it uses XHProf, a PHP profiler made by the Facebook Dev Team (you must install it before activating the plugin).
Usage
By default the profiling is disabled, activate WP_DEBUG on your wp-config.php to enable it. After doing it, all your wordpress pages will have a link at bottom with the profiling data.
¿What is XHProf?
From http://www.php.net/manual/en/intro.xhprof.php
XHProf is a light-weight hierarchical and instrumentation based profiler. During the data collection phase, it keeps track of call counts and inclusive metrics for arcs in the dynamic callgraph of a program. It computes exclusive metrics in the reporting/post processing phase, such as wall (elapsed) time, CPU time and memory usage. A functions profile can be broken down by callers or callees. XHProf handles recursive functions by detecting cycles in the callgraph at data collection time itself and avoiding the cycles by giving unique depth qualified names for the recursive invocations.
XHProf includes a simple HTML based user interface (written in PHP). The browser based UI for viewing profiler results makes it easy to view results or to share results with peers. A callgraph image view is also supported.
XHProf reports can often be helpful in understanding the structure of the code being executed. The hierarchical nature of the reports can be used to determine, for example, what chain of calls led to a particular function getting called.
XHProf supports ability to compare two runs (a.k.a. "diff" reports) or aggregate data from multiple runs. Diff and aggregate reports, much like single run reports, offer "flat" as well as "hierarchical" views of the profile.
Additional documentation can be found via the xhprof website » [http://pecl.php.net/package/xhprof]
Support
Comments, questions, feature requests and bug reports are welcome: http://www.berriart.com/en/xhprof-profiler/


